What’s the Latest?
Real Estate News

Taking Stock of It All
In today’s newsletter I’m covering several important themes: the stark divergence between record corporate profits (especially AI-driven) and national housing trends, the latest housing data, gold’s historic overtake of U.S. Treasuries as the world’s top central bank reserve asset, an interesting 30-year comparison of Monterey real estate versus gold, the long-term impact of money printing on housing prices, and the proposed “mansion tax” in Monterey County.
Local Q1 2026 market numbers for Monterey County and the Peninsula are at the very end; feel free to skip straight there if you’d like the local story first.
Corporate Profits vs. National Housing: A Tale of Two Markets
While the national housing market continues to move toward balance, corporate America, particularly the companies driving the AI boom, is delivering strong results. The largest U.S. public companies are on track for 13%+ earnings-per-share growth for the sixth consecutive quarter.
The Mag 7 Effect
Four of the seven Magnificent 7 companies (Apple, Google, Meta, NVIDIA) are headquartered in the Bay Area. Here’s how their local market compares to the national picture:
National Average: Median price ~$436,000, up 1.7% year-over-year, with homes taking around 54 days to sell. Overall market temperature - cooling with more inventory and price reductions.
Bay Area: Median price ~$2,000,000, which is up 18% (!) year-over-year with homes taking only 10 days to sell. Overall market temperature - hot, strongly outperforming many other areas, and very competitive.
What This Means for Monterey County
Localized wealth concentration matters far more than national averages. Strong corporate profits, stock grants, and executive compensation in the Bay Area continue to support demand in premium coastal markets like Monterey through second-home purchases, relocations, and cash buyers seeking quality of life.
National Housing Market – What the Latest Data Is Telling Us
New listings rose 3% year-over-year in the four weeks ending April 19, the largest increase since November.
Mortgage rates eased to 6.3% (down from 6.46% two weeks earlier).
Pending home sales declined only 1.2% year-over-year, the smallest decline in recent months.
Home price growth slowed to +1.7% YoY in March, the slowest annual growth since 2012.
Median days on market increased to 54 days (5 days longer than a year ago).
Price reductions rose to 18% of listings (up from 16% a year ago).
Only 25.6% of homes sold above list price.
For buyers: More inventory, more negotiation room, and modest rate relief create a real window of opportunity, though competition can return quickly.
For sellers: Pricing correctly from day one and a strong presentation are more important than ever.
Gold Overtakes U.S. Treasuries as the World’s #1 Central Bank Reserve Asset
For the first time in 30 years, central banks now hold more gold ($4 trillion) than U.S. Treasuries ($3.9 trillion). Decades of government spending and money printing have clearly eroded confidence in fiat currency.
With all this talk of Gold over the past several years, I ran a split test investing scenario for fun - what if you had around $60K in cash to invest in 1996 - should you have just bought gold or put that money down on a rental property on the Monterey Peninsula?
The Seed Money Showdown: Monterey Real Estate vs. Gold (1996–2026)
If you had $58,750 in 1996, which path would have performed better?
Path A – Gold (100% passive)
Purchased ~150 ounces at ~$390/oz
Today’s value (gold at $4,718/oz): $710,724
Total return: +1,109% (12× your money)
Path B – Monterey County Rental Property (passive + leveraged)
25% down on a $235,000 home (average price in 1996) with a 7.5% mortgage (rate in 1996)
After professional management (goal is to be hands-off), vacancy, maintenance, CapEx, and mortgage costs over 30 years:
Net rental income after expenses: $706,866
2026 home value (free and clear): $838,000
Total wealth created: $1,100,714 (after $443,652 in mortgage payments)
Total return on your original $58,750: +1,774% (18.7× your money).
Even after realistic carrying costs, the Monterey home outperformed gold by nearly $400,000.
How well did the S&P 500 do over the same time period? Well, your $58,750 would have turned into $1,072,000, much closer to the return on real estate (but you would have missed out on some nice tax deductions along the way).
A 30-Year Fixed Mortgage Is a Long-Dated Call Option on Inflation
What does this mean? You borrow today’s dollars at a fixed rate and repay in tomorrow’s cheaper dollars while your house price rises with the tide of new money. You are long the house and short the dollar. Let me try to illustrate how and why this happens in more detail:
U.S. Housing Supply vs. Money Supply (1974–2026)
Housing units roughly doubled (76 million → ~145 million) over this 52-year period
The U.S. population grew 64% (213.9 million → ~349 million) over the same period
M2 money supply grew ~25× ($0.9 trillion → $22.44 trillion) during the same 52 years
More dollars (a LOT more) chasing a relatively constrained supply of homes is a primary driver of long-term price appreciation. Logically, if the money supply had not expanded at all over the past 52 years, homes today could actually be cheaper than in 1974, since housing supply doubled while population grew only 64%.
Looking ahead, I do not expect money printing or government deficit spending to slow meaningfully in the coming years. As a result, I anticipate continued upward pressure on asset prices, particularly on desirable real estate.
Local Policy Watch: The Proposed “Mansion Tax”
Monterey County supervisors voted unanimously to study placing a new real estate transfer tax on the November ballot for multimillion-dollar homes in unincorporated areas (Carmel Valley, Carmel Highlands, Pebble Beach, Big Sur). Projected revenue: $1.7M–$8.7M annually, depending on the rate (1–5%).
Los Angeles’ Measure ULA (the original “mansion tax”) has raised over $1 billion since 2023, yet:
High-end transaction volume dropped 38–55%
Property tax revenue loss from fewer sales offsets a significant portion of collections
Only ~175–187 genuinely new affordable units have been completed so far
My take: We need supply-side solutions such as faster permitting, pre-approved designs, and fee waivers for affordable projects, not new taxes that further constrain transactions and development. Five California cities are already moving in this direction.
Q1 2026 Market Update: Monterey County & Monterey Peninsula
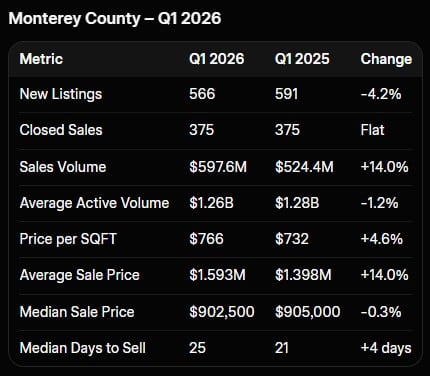
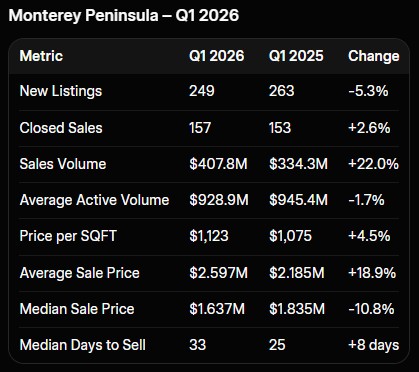
The first quarter of 2026 reflected continued resilience in the Monterey real estate market. While new listings moderated slightly, sales volume increased meaningfully year-over-year in both the county and the Peninsula, driven by higher average prices. Buyers continue to take more time to decide, resulting in longer days on market.
Monterey County – Q1 2026
Monterey Peninsula – Q1 2026
Key Takeaways for Q1 2026
Sales volume rose significantly in both areas (+14% county-wide, +22% on the Peninsula), fueled by higher average transaction prices.
The number of closed sales remained stable or modestly higher, while new listings declined slightly, contributing to tighter active inventory on the Monterey Peninsula.
Buyers are exercising greater caution, with median days to sell increasing notably (especially on the Peninsula).
Price per square foot continued its upward trend in both markets, confirming sustained demand for well-located properties.
Overall, the first quarter of 2026 points to a healthy, balanced market with strong pricing power despite a more measured pace of transactions. This environment continues to favor well-prepared sellers. Buyers are granted more time to evaluate options as the median days to sell in both the County and on the Peninsula are up year over year. Homes priced above the median price range continue to do well, while more affordable options struggle to find buyers.
Worked with me in the past? Share your experience.

Jonathan Balog
DRE# 01980970
Broker
M: 831.747.0310
[email protected]
Compass is a real estate broker licensed by the State of California operating under multiple entities. License Numbers 01991628, 1527235, 1527365, 1356742, 1443761, 1997075, 1935359, 1961027, 1842987, 1869607, 1866771, 1527205, 1079009, 1272467. All material is intended for informational purposes only and is compiled from sources deemed reliable but is subject to errors, omissions, changes in price, condition, sale, or withdrawal without notice. No statement is made as to the accuracy of any description or measurements (including square footage). This is not intended to solicit property already listed. No financial or legal advice provided. Equal Housing Opportunity. Photos may be virtually staged or digitally enhanced and may not reflect actual property conditions.