


The Balog ReportEdition No. 85October 2026
(Not) Stuck in the Middle
Rates Aren't High. Affordability Is.

- 7%+30-Year Mortgage Rate
- 16.5xPeninsula Price-to-Income Ratio
- $2.46MAvg. Sale Price, All-Time High
- $1.65MMedian Sale Price, Below 2023 Peak
The short version
- The rate is not the disease. The price-to-income ratio is. Here it sits at 16.5 times local median income, more than three times the level housing economists consider severely unaffordable.
- The median sale price is $1,650,000 so far in 2026, a 2.9% decline from the 2023 peak, while the average has climbed to $2,459,394, an all-time record. The market is bifurcating.
- 7% is not historically severe. Mortgage rates topped 18% in late 1981; it was the near-zero rate environment after 2008 that was the anomaly.
- October is the best month to buy, per ATTOM: premiums above market value drop to about 3.3%, compared to 10.5% in May. On the Peninsula, being financially prepared matters most.
The Setup
The Federal Reserve raised rates on September 16th for the first time since July 2023, a unanimous 12-0 vote to push the federal funds target range to 3.75%—4.00%. The dot plot signals at least one more hike possible before year-end. The first increase in more than three years was not a surprise. Markets had been pricing it in for weeks. But it was a statement. The committee looked at still-elevated inflation, a resilient labor market, and persistent energy costs, and decided the job wasn't finished.
That last item deserves more attention than it typically gets. A meaningful share of the current inflation reading is being driven by elevated energy prices tied to the ongoing conflict in the Middle East. Oil and diesel prices do not stay in their lane. They ripple through the cost of transportation, manufacturing, food production, and construction. That kind of cost-push inflation is structurally different from the demand-pull inflation the Fed's tools were designed to address. Raising rates is a demand-side lever. It cannot fix a supply-side energy shock. So the committee finds itself applying the only instrument it has to a problem that instrument can only partially cure, and the cost of that blunt tool is being paid most directly by anyone who needs a mortgage.
The bond market had already been sending the same message. The 10-year Treasury crossed 5% in mid-September, its highest level since 2023. The 30-year mortgage rate is now around 7%, with some lenders already above that threshold on jumbo loans, having risen for four consecutive weeks following the hike. For buyers who need financing, this is the environment they are navigating. For sellers, it is the environment shaping their buyer pool. And for anyone trying to make sense of what is happening to the housing market and why it feels the way it does, the rate number alone doesn't tell the full story.
The Anchoring Problem
Seven percent feels like a punishment. But whether it actually is depends on what you use as your baseline.
For the past decade, the baseline most people carry in their heads is somewhere around 3%. That is what mortgages cost for most of the period between 2010 and 2021, and the human mind has a well-documented tendency to treat the recent past as normal. Measured against 3%, a rate of 7% feels like a betrayal. But that is a feeling, not a fact.
The longer view tells a different story. From the 1970s through the 1990s, the 30-year fixed mortgage spent years in the high single digits and routinely touched double figures. September, October, and November of 1981 all saw mortgage rates above 18%. The decades of 5%, 6%, and 7% mortgages that followed were not considered a crisis. They were simply the cost of financing a home. It was the near-zero rate environment after 2008 that was the historical anomaly, not today's 7%.
This matters because the policy response to COVID, which pushed rates to generational lows and kept them there for years, did something subtle and lasting to our collective sense of what borrowing should cost. We anchored to an extreme. Now that the extreme has passed, the return to something closer to historical norms reads as hardship. The discomfort is real. The framing is not.
Understanding the anchoring problem does not make the monthly payment smaller. But it does reframe the question. The issue is not that 7% is historically severe. It is something else entirely, and that something else is what actually explains why this market feels the way it does right now.
Blame the Ratio, Not the Rate
Rates make an easy villain. 7% is not the problem. 7% on a price that already ran 50% above wages. That is the problem.
We financed homes at 7% for decades without the level of strain the market is experiencing today. The reason is straightforward: a monthly payment is not just a function of the rate. It is a function of rate times price. And over the first half of this decade, both variables moved hard and fast at the same time.
Between 2019 and 2022, the median home price on the Monterey Peninsula rose 49%. Nationally, the picture was similar, with median prices climbing 40% or more in many markets. Then, beginning in 2022, mortgage rates more than doubled in a matter of months. Those two forces do not add together. They compound. The result was that the monthly payment on a median-priced home roughly doubled in a period of about three years, not because the rate alone became unaffordable, but because a dramatically higher rate was being applied to a dramatically higher base.
That is the affordability crisis. Not 7% in isolation. 7% on prices that already outran wages.
Rates make an easy villain because they are a single number in every headline, updated daily, easy to follow and easy to blame. But the rate is not the disease. The price-to-income ratio is. And here is the additional complication: the mechanism that would normally relieve the pressure is being suppressed by the same force creating it. Homeowners who refinanced at 3% in 2020 or 2021 are not selling. Why would they? Trading a 3% mortgage for a 7% mortgage on a new purchase, even at the same price point, means a payment increase of 40% or more. So they stay. Inventory stays thin. Prices stay elevated. And the cycle continues to spin.
The Fed can raise rates. It cannot fix the ratio.
The Hollowing Out: What the Peninsula Data Shows
The figures below cover single-family residential home sales on the Monterey Peninsula, drawn directly from the MLS.
Since 2023, the median sale price on the Peninsula has declined. In 2023 it peaked at $1,700,000. It fell to $1,600,000 in 2024, recovered slightly to $1,626,500 in 2025, and sits at $1,650,000 so far in 2026. That is a 2.9% decline from the 2023 peak, with no full recovery in sight. At the same time, the average sale price has climbed to $2,459,394 in 2026, an all-time record and a 7.6% increase from 2023.
Single-family residential · MLS · scale $0—$2.5M
Median sale price (2026 in navy) 2026 average sale price ($2,459,394, an all-time record). 2026 figures are so far this year.
The ratio of average to median on the Peninsula has been relatively stable over time, running at roughly 1.5 times. But the direction of movement since 2023 is what demands attention. The median has declined while the average has risen to an all-time high. In a healthy, broadly functioning market, the two tend to move together. When the average rises while the median falls, volume is concentrating at the upper end of the market. The top of the market is not only holding, it is setting records. The middle is softening.
This is what a bifurcating market looks like from the inside. The headline numbers, taken separately, can obscure it. Taken together, they reveal it clearly.
The market is bifurcating between buyers insulated from today's affordability equation, cash, equity, and Bay Area wealth, and those who are not.
The Haves and Have-Nots
In 2025, the U.S. Census Bureau reported that the median household income rose 2.6% to $87,460, a record high. The official poverty rate fell to 10.2%, its lowest level since the bureau began tracking the measure. By those measures, the country is doing better than it has in a long time.
The Peninsula has never been an affordable market by any conventional standard. What has changed is the composition of who can still participate. The price-to-income ratio here sits at 16.5 times local median income. Housing economists generally consider a ratio above 5 to be severely unaffordable. The Peninsula is running at more than three times that threshold. At current rates and prices, the buyer pool capable of transacting near the median has narrowed to equity-rich locals trading up or downsizing, second-home buyers with significant assets from elsewhere, and cash buyers insulated from the rate environment entirely. The move-up buyer relying on financing, and the first-time buyer, are effectively priced out.
Before wealth can be shared it has to be created, and the Monterey Peninsula has always attracted the people doing the creating. But when even locally above-average earners cannot access the median home without stretching well beyond any reasonable financial guideline, the definition of who belongs in this market has quietly narrowed.That narrowing is what the divergence between average and median sale prices is measuring.
The Longevity Factor
There is a demographic force quietly reshaping the housing supply picture that rarely appears in the standard market commentary. It has nothing to do with interest rates or inflation. It has to do with how long people are living.
A 65-year-old woman today has approximately a 40% chance of reaching age 90. For a 65-year-old couple, the odds that at least one spouse reaches 90 are roughly 50%. Americans who reach 65 can now expect an average of 19 to 20 more years of life, and averages understate the planning problem because half of all retirees will live longer than that. Most of the classic financial planning rules were written for a retirement that ended around 85. The runway is now meaningfully longer, and the plans have not caught up.
Longer lives mean people stay in their homes longer. Older households already own a disproportionate share of U.S. housing wealth, and the longer they live, the longer that wealth stays put. On the Monterey Peninsula, many owners treat their properties as lifestyle anchors rather than financial assets. A home in Pebble Beach or Carmel is often a place around which a retirement has been built. That means fewer listings come to market even when prices would seem to justify a sale.
Longer lives also delay inheritance. Larger homes stay in the hands of older owners for more years before being passed to the next generation. That delay keeps supply tight in desirable locations and makes entry harder for younger buyers. The handoff is slowing. The inventory that would come from it is being deferred.
The irony is not lost. The very prosperity that makes the Peninsula an attractive place to live and age in place is part of the mechanism keeping the next generation of buyers out.
October Is the Best Month to Buy
In a market defined by elevated rates, thin inventory, and compressed affordability, timing still matters. ATTOM, which has studied more than 39 million single-family home and condo sales over the past decade, identifies October as the best month of the year for buyers. Premiums paid above market value drop to approximately 3.3% in October, compared to 10.5% in May. Sellers who did not transact in the spring or summer are recalibrating their expectations. The pressure of the holiday season approaching adds its own quiet urgency.
A few honest caveats for the Peninsula specifically. The national data is directionally useful but the dynamics here are not identical to the broader U.S. market. Motivated sellers exist here year-round, and the best deal is often found not by waiting for a specific calendar window but by being financially prepared and ready to move when the right property comes available.
That said, the fall window is real and worth using. With mortgage rates where they are, any buyer who has found a property they want and can genuinely afford should be thinking seriously about making an offer rather than waiting for a rate environment that may not materially improve before year-end. The market rewards preparedness. It always has.
What This Means for the Peninsula
Pull all of it together and a coherent picture emerges, even if it is not a simple one.
The Monterey Peninsula luxury market is not in distress. The structural supports remain intact: limited supply, irreplaceable coastal geography, a deep and recurring pool of high-net-worth buyers connected to Bay Area wealth creation, and an ownership base with the financial means to hold through periods of uncertainty. Those fundamentals do not disappear because the Fed raised rates.
What is happening is more subtle and more durable than a cyclical slowdown. The market is bifurcating between buyers insulated from today's affordability equation and those who are not. Cash buyers and equity-rich buyers are transacting with confidence, in some cases at record prices. The upper end of this market is also the largest beneficiary of the Bay Area wealth pipeline. Liquidity events from the technology sector, equity compensation, and generational wealth concentrated in the region continue to produce buyers for whom the Peninsula represents a destination rather than a compromise.
For sellers, the data points in a familiar direction. Realistic pricing from the outset, combined with genuine flexibility when a serious buyer arrives, produces better outcomes than aspirational pricing followed by reductions. The buyers who are active right now are deliberate and well-informed. They will not be rushed by a seller who is not aligned with the market.
For buyers, the picture is nuanced but not discouraging. There is more negotiating room in this market than there has been in several years, particularly for properties where the seller has been waiting through the spring and summer without finding their buyer. The buyers who have their financing arranged, their criteria clear, and their process ready to move are the ones who will close on the properties that others are still deliberating over.
The longer arc of this market favors ownership. The supply constraints are structural and are not going to be resolved by a policy change or a rate cut. The demographic forces keeping existing owners in place are intensifying rather than easing. And the Peninsula's fundamental scarcity, of land, of water, of buildable inventory, of comparable coastal lifestyle, is not a temporary condition.
The lower end and the middle are under pressure, with the lower end feeling it most acutely. The top is not. And understanding that distinction is, right now, the most useful thing a buyer or seller on the Monterey Peninsula can know.
This analysis covers the Monterey Peninsula residential real estate market. All MLS data covers single-family residential sales and is sourced directly from the local multiple listing service. National economic data is sourced from the U.S. Census Bureau, the Federal Reserve, Freddie Mac, Realtor.com, and ATTOM. This newsletter is analysis and informed perspective, not personalized financial or legal advice. Jonathan Balog is an Associate Broker with Compass Real Estate, DRE# 01980970.
What this means for you
Fog or sun, village or forest, bay or open ocean. Pick which corner of the Peninsula fits, then we can talk numbers.
Price it right from the start
The buyers active right now are deliberate and well-informed. Realistic pricing from the outset, against what is actually moving, beats aspirational pricing followed by reductions. I'm happy to help you find that number for your home.
See what your home is worthBe ready when the right home appears
There's more negotiating room here than there has been in several years, especially on homes that waited through spring and summer. The buyers with financing arranged and clear criteria are the ones who close. Let's get you ready.
Book a 30-minute callPopular from The Balog Report
A data-driven evergreen guide from a recent issue.
The Price You Pay for Waiting
1 in 3 $2M+ Peninsula sales needed a price cut — here’s what waiting really costs.
Made it this far? Stay a while.
Fog or sun, village or forest, bay or open ocean. If you're curious about a particular corner of the Peninsula, start here.
Start here: explore all Peninsula areas
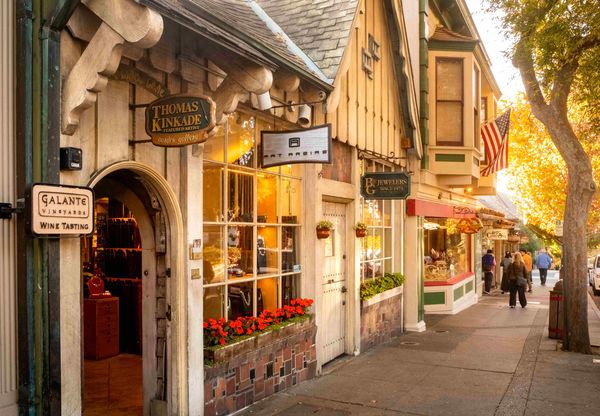 Carmel-by-
the-Sea Its own little village, best on foot. Until recently, homes here didn't even have street addresses. Greater CarmelThe neighborhoods around the village, from Carmel Point to Jacks Peak, each with its own character.
 Pebble BeachHome in the Del Monte Forest, with world-famous golf just down the road.
 Carmel ValleySunnier and warmer, with a relaxed village feel a short drive inland.
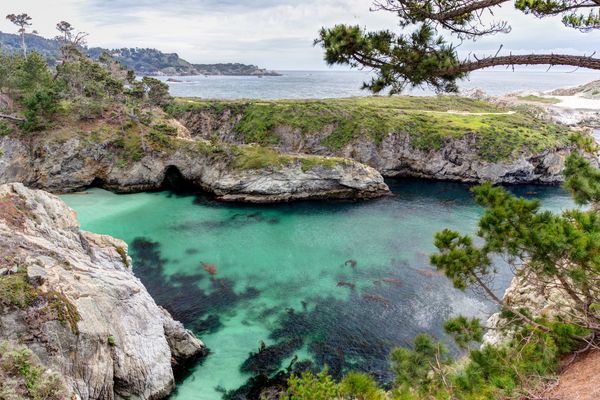 Carmel HighlandsOpen ocean views, with homes from the water's edge up to nearly 1,000 feet above the sea.
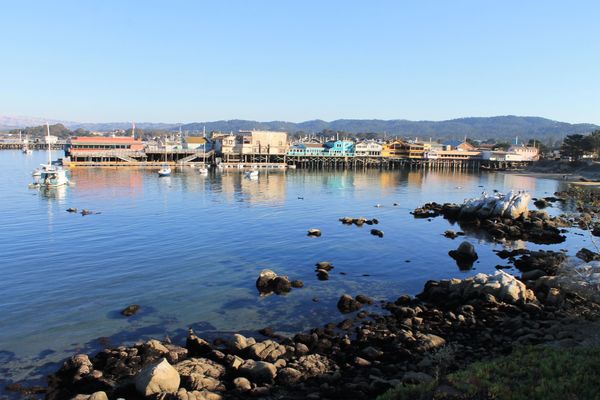 MontereyA real downtown, Cannery Row, and neighborhoods from the bay up into the hills, including Pasadera.
 Pacific GroveVictorian cottages, a shoreline trail, and a little fog. America's Last Hometown.
 MarinaNewer neighborhoods, easy Highway 1 access, and walkable shopping at The Dunes.