


Monterey Peninsula real estate market stats
One place to open the area stats pages for Carmel-by-the-Sea, the Carmel area, Pebble Beach, Carmel Valley, Carmel Highlands, Pacific Grove and Monterey.
The short version: Each area page lets you pull up metrics such as median price, days on market, or price per square foot for any month back to January 2002, and toggle between nominal and inflation-adjusted figures.
Open the stats for the area you care about
The headline figure on each card is the median sale price shown on that area page on November 10, 2026. It is the average of monthly median sale prices over the trailing 12 months, for single-family homes. The periods are not identical across every area, so the cards are not a same-month comparison. Open the page for the charts, later updates, and the other metrics.
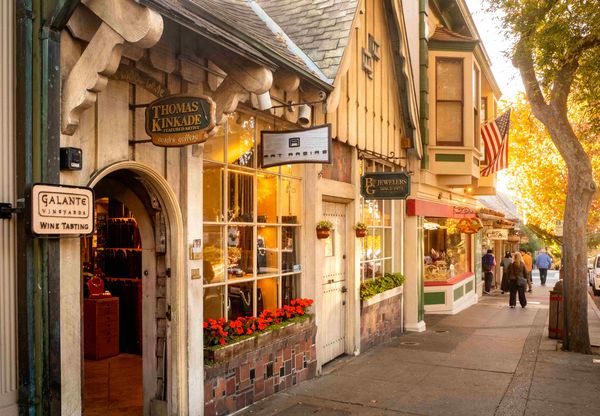
Carmel-by-the-Sea
Median sale price
$3.47M
October 2025 through September 2026
Open Carmel-by-the-Sea stats
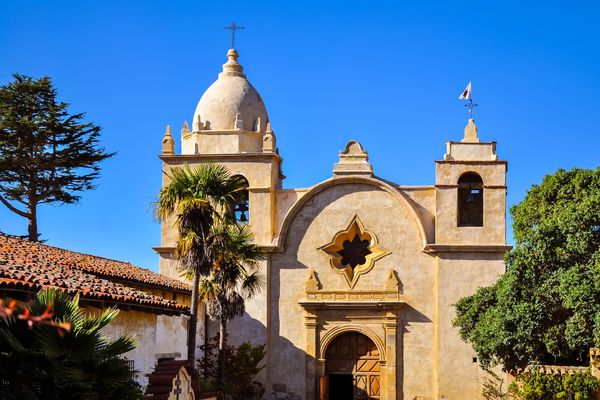
Carmel area
Median sale price
$2.47M
October 2025 through September 2026
Open Carmel area stats
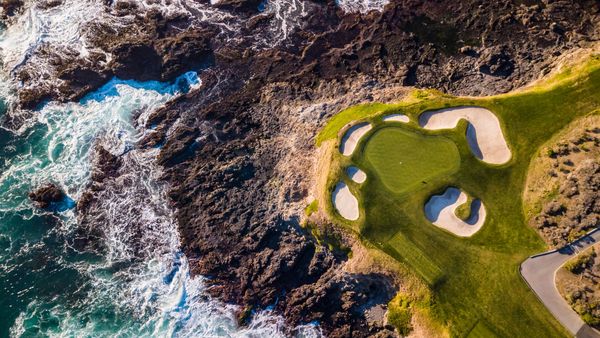
Pebble Beach
Median sale price
$3.21M
October 2025 through September 2026
Open Pebble Beach stats
Carmel Valley
Median sale price
$1.71M
November 2025 through October 2026
Open Carmel Valley stats
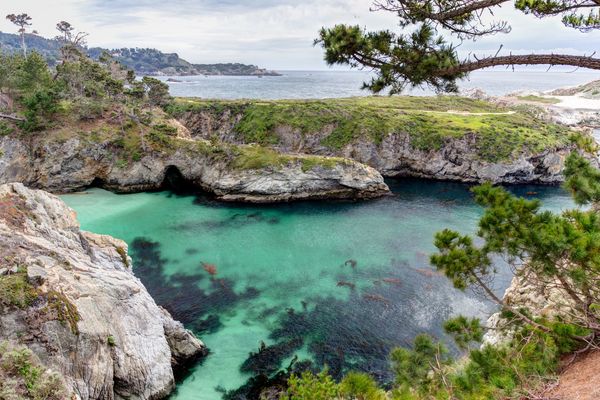
Carmel Highlands
Median sale price
$4.93M
November 2025 through October 2026
Open Carmel Highlands stats
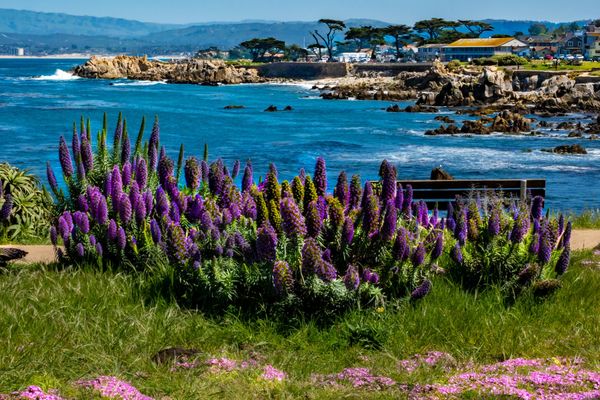
Pacific Grove
Median sale price
$1.37M
November 2025 through October 2026
Open Pacific Grove stats
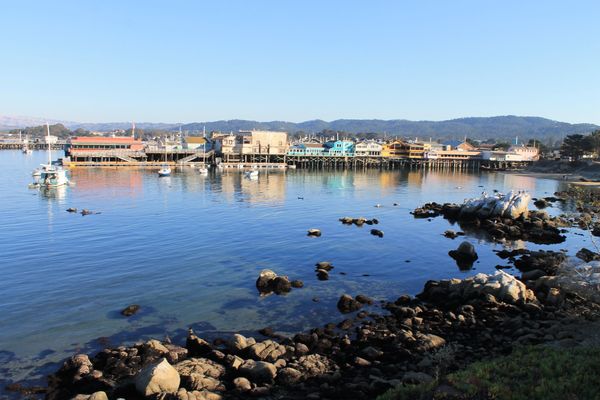
Monterey
Median sale price
$1.26M
November 2025 through October 2026
Open Monterey stats
How to read the figures
On each area page you can pull up metrics such as median price, days on market, or price per square foot for any month back to January 2002, and toggle between nominal and inflation-adjusted figures.
Some sales may appear in both the Carmel and Carmel Valley figures because the MLS area filters overlap. If you are comparing those two pages, ask me to walk through how a given property was coded.
Carmel-by-the-Sea, the Carmel area and Pebble Beach were last updated through September 2026, with headline figures covering October 2025 through September 2026. Carmel Valley, Carmel Highlands, Pacific Grove and Monterey were last updated through October 2026, with headline figures covering November 2025 through October 2026.
The Carmel area page covers nine neighborhoods around the town of Carmel-by-the-Sea (Carmel Point, Hatton Fields, Carmel Woods, Carmel Meadows, Mission Fields, Carmel Views and Rancho Rio Vista, Carmel Hills, High Meadows and Jacks Peak). Homes inside the town itself are on the Carmel-by-the-Sea stats page.
Want help reading the numbers for a specific house?
I work with buyers and sellers in Carmel-by-the-Sea, the Carmel area, Pebble Beach, Carmel Valley and Carmel Highlands. If you want to see how a property compares with these figures, I am happy to walk through it with you.
Talk through a move
A short call is often enough to tell whether an area and a budget line up.
Before you rely on this
- Headline figures were copied from the linked area pages on November 10, 2026. Those pages are updated as new monthly data is posted, so open the live page for the current numbers.
- These pages cover single-family home sales. Condos and land are excluded unless a specific page says otherwise.
- A median is a midpoint, not a promise of what any one house will sell for. Small markets can swing on a handful of sales.
- This page is general information, not a formal appraisal, and not legal, tax or lending advice.
Frequently asked questions
Which Monterey Peninsula areas have market stats pages?
Carmel-by-the-Sea, the Carmel area, Pebble Beach, Carmel Valley, Carmel Highlands, Pacific Grove and Monterey each have a live stats page, linked from the cards above.
How far back does the data go, and what can I look up?
On each live area page you can pull up metrics such as median price, days on market, or price per square foot for any month back to January 2002, and toggle between nominal and inflation-adjusted figures.
Why might a sale show up in both the Carmel and Carmel Valley figures?
Some sales may appear in both the Carmel and Carmel Valley figures because the MLS area filters overlap. If you need a clean read on a specific property, I can help you see how it was coded.
Are the headline figures for the same 12-month period on every card?
Not necessarily. On November 10, 2026, the Carmel-by-the-Sea, Carmel area and Pebble Beach pages showed October 2025 through September 2026, and the Carmel Valley, Carmel Highlands, Pacific Grove and Monterey pages showed November 2025 through October 2026. Each card lists the period used on that page.
Get The Balog Report.
Peninsula market notes, Carmel-by-the-Sea and Pebble Beach listings worth a look, and the practical local tips I share with clients between showings.
Want a sample? Read the latest issue. Planning a move? Get in touch.
The next issue of The Balog Report will land in your inbox. Can’t wait? Read the latest issue.